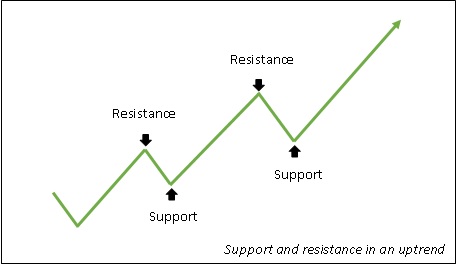
Support and Resistance
Introduction of Technical Analysis: Support and Resistance
Support and resistance are two of the terms used in technical terms the most frequently. These are two terms that are commonly used in financial publications, media, etc., even for those who are not familiar with technical analysis. So what does it mean to be support and resistance exactly?
The three different trends: up, down, and sideways. We defined as uptrend as a sequence of rising peaks and troughs wherein each peak is above its previous peak and each trough is above its previous trough. In this sequence, each rising peak is called an area of resistance while each rising trough is called an area of support.
Resistance
A resistance is a place where the forces of supply and demand are greater than one another, which lowers the price of an asset. Often, a chart's historical price movement can be used to pinpoint a region of resistance. The area where buying (demand) is less than selling (supply) is typically when prices shift from rising to falling. Stated differently, resistance represents the peak attained prior to a downward price shift.Support
A support is a place where the forces of supply and demand are greater than each other, pushing up the price of an item. Frequently, examining the historical price movement on a chart might help determine a region of support. It is typically the area where the difference between supply and demand—buying—causes the price to move from downward to upward. Support is, to put it simply, the lowest point at which the price fell before rising again.


Post Comment