
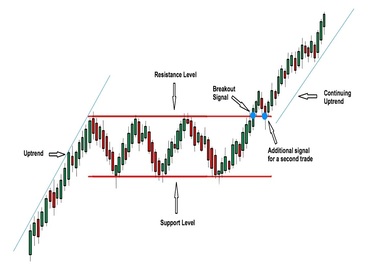
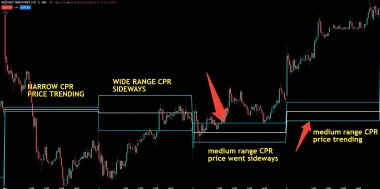
Introduction: Why Sideways Trends and Psychology Matter in Trading Markets don’t always move up or down. Sometimes, they pause, consolidate, and move sideways. This phase—known as a sideways tren

Introduction: Why Downtrend Lines and Psychology Define Trading Success Trading is not just about spotting opportunities—it’s about recognizing risks, managing emotions, and applying strategies w

Introduction: Why These Three Pillars Matter Trading success is built on three interconnected foundations: technical clarity (trend lines), mental discipline (psychology), and practical execution (st

Introduction: Why Trend Lines and Psychology Define Trading Success Trading is not just about numbers on a chart—it’s a blend of technical analysis, psychological discipline, and strategic execut

1. Introduction to the Island Reversal The Island Reversal chart pattern is a rare but powerful reversal signal in technical analysis. It forms when a cluster of price bars becomes isolated by gaps

1. Introduction to the Broadening Wedge The Broadening Wedge, also known as the Expanding Triangle, is a chart pattern that reflects increasing volatility. Unlike symmetrical triangles that narrow o

1. Introduction to the Triple Bottom Pattern The Triple Bottom chart pattern is a bullish reversal formation. It occurs when price tests a support level three times without breaking below, signaling

1. Introduction to the Triple Top Pattern The Triple Top chart pattern is a bearish reversal formation. It occurs when price tests a resistance level three times without breaking through, signaling

1. Introduction to Exhaustion Gaps The Exhaustion Gap chart pattern is a technical signal that occurs near the end of a strong trend. It represents a final surge in price, often driven by emotional

1. Introduction to Runaway Gaps The Runaway Gap chart pattern (also known as a measuring gap or continuation gap) is a powerful signal in technical analysis. It occurs midway through a strong trend,

1. Introduction to Breakaway Gaps The Breakaway Gap chart pattern is one of the most powerful signals in technical analysis. It occurs when price opens significantly higher or lower than the previou

1. Introduction to Gaps in Technical Analysis A Gap Chart Pattern occurs when a stock’s price opens significantly higher or lower than the previous closing price, leaving a visible gap on the chart

1. Introduction to the Inverse V Pattern The Inverse V Chart Pattern is a sharp bearish reversal formation. It is characterized by a steep rise followed by an equally sharp decline, forming an inver

1. Introduction to the V Chart Pattern The V Chart Pattern is a sharp reversal formation. It is characterized by a steep decline followed by an equally sharp recovery, forming a distinct “V” sha

1. Introduction to the Dead Cat Bounce Pattern The Dead Cat Bounce chart pattern is a bearish continuation formation. It occurs when a steep decline is followed by a temporary recovery, only for the

1. Introduction to the Elliott Wave Pattern The Elliott Wave chart pattern is a cyclical formation that identifies market trends through five impulsive waves followed by three corrective waves. Deve

1. Introduction to the Three Drives Pattern The Three Drives chart pattern is a harmonic reversal formation. It is characterized by three consecutive price swings in the same direction, each complet

1. Introduction to the Bearish Flag Pattern The Bearish Flag chart pattern is a continuation formation that occurs during a downtrend. It represents a pause in the trend where price consolidates wit

1. Introduction to the Bullish Flag Pattern The Bullish Flag chart pattern is a continuation formation that occurs after a sharp upward price movement. It represents a brief consolidation phase wher

1. Introduction to the Bearish Rectangle Pattern The Bearish Rectangle chart pattern is a continuation formation that occurs during a downtrend. It represents a pause in the trend where price consol
1. Introduction to the Bullish Rectangle Pattern The Bullish Rectangle chart pattern is a continuation formation that occurs during an uptrend. It represents a pause in the trend where price consoli

1. Introduction to Channel Chart Patterns The Channel Chart Pattern is a continuation formation that occurs when price oscillates between two parallel trendlines. Channels can slope upward (bullish
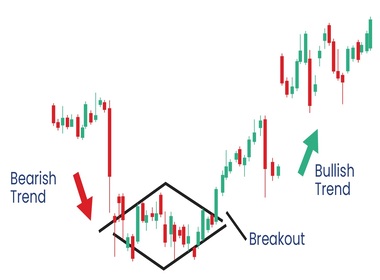
1. Introduction to the Diamond Bottom Pattern The Diamond Bottom chart pattern is a bullish reversal formation. It signals that a downtrend is losing momentum and may reverse into an uptrend. Trade

1. Introduction to the Diamond Top Pattern The Diamond Top chart pattern is a bearish reversal formation. It signals that an uptrend is losing momentum and may reverse into a downtrend. Traders rec

1. Introduction to the Inverse Cup and Handle Pattern The Inverse Cup and Handle chart pattern is a bearish reversal formation. It signals that an uptrend is losing momentum and may reverse into a d

1. Introduction to the Rounding Top Pattern The Rounding Top chart pattern is a bearish reversal formation. It signals that an uptrend is losing momentum and may reverse into a downtrend. Traders r

1. Introduction to the Symmetrical Triangle Pattern The Symmetrical Triangle chart pattern is a bilateral formation that can be either bullish or bearish. It is most often a continuation pattern, me

1. Introduction to the Descending Triangle Pattern The Descending Triangle chart pattern is a bearish continuation formation. It signals that a downtrend is likely to continue after a period of cons

1. Introduction to the Ascending Triangle Pattern The Ascending Triangle chart pattern is a bullish continuation formation. It signals that an uptrend is likely to continue after a period of consoli

1. Introduction to Pennant and Flag Patterns The Pennant or Flag chart pattern is a short-term continuation formation that occurs after a sharp price movement. It represents a pause in the market be

1. Introduction to the Falling Wedge Pattern The Falling Wedge chart pattern is a bullish formation that often signals a reversal or continuation to the upside. It forms when price action is confine

1. Introduction to the Rising Wedge Pattern The Rising Wedge chart pattern is a bearish formation that often signals a trend reversal or continuation to the downside. It forms when price action is c

1. Introduction to the Cup and Handle Pattern The Cup and Handle chart pattern is a bullish continuation signal. It reflects a temporary pause in an uptrend before the market resumes higher. Trader

1. Introduction to the Rounding Bottom Pattern The Rounding Bottom chart pattern (also called a “saucer bottom”) is a long-term bullish formation. It signals either a continuation of an uptrend
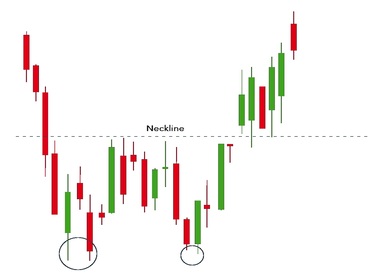
1. Introduction to Double Bottom Pattern The Double Bottom chart pattern is a bullish reversal signal. It forms after a prolonged downtrend, indicating that selling pressure is weakening. Traders o

1. Introduction Double Top Pattern is one of the most recognized bearish reversal patterns in technical analysis. It signals that an uptrend may be ending and sellers are gaining control. Traders i

1. Introduction: Why Chart Patterns Matter in Trading Chart patterns are visual representations of market psychology. They help traders anticipate trend reversals or continuations. Among these, the

1. Introduction: Why Chart Patterns Matter in Trading Technical analysis is built on the idea that price action reflects collective market psychology. Among reversal patterns, the Head and Shoulders

What Are Chart Patterns in Trading? Chart patterns are visual formations created by price movements on a trading chart. They act as roadmaps, showing traders where an asset might head next based
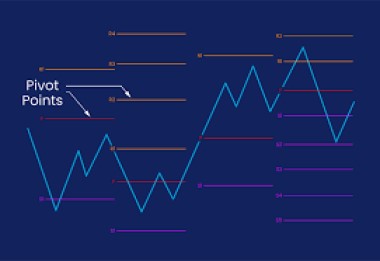
Pivot Points in Trading: What They Are, Why They Work, and How to Build a Winning Strategy In trading, price rarely moves randomly. It reacts to levels. Some levels behave like floors where
Introduction Trading in financial markets is often compared to navigating a maze. Every trader seeks reliable tools to identify direction, momentum, and potential turning points

Introduction Trading is as much about psychology as it is about mathematics. Every chart tells a story, but without the right tools, that story can be misleading. Technical ind
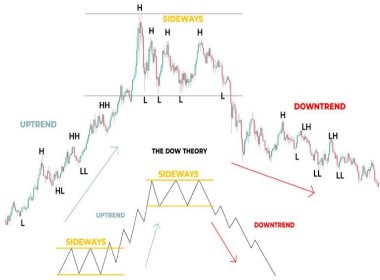
Introduction Technical analysis is a cornerstone of modern trading. Among its foundational frameworks, Dow Theory remains one of the most influential. Traders worldwide rely on
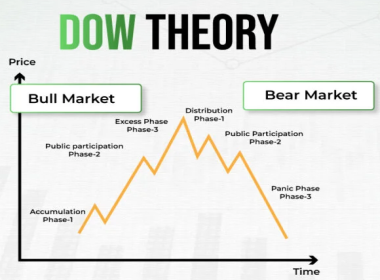
Introduction Technical analysis is the backbone of modern trading strategies, and at its foundation lies the Dow Theory. Developed in the early 20th century by Charles H. Dow, c

Introduction Financial markets are driven by human psychology, and technical analysis provides tools to decode that psychology. Among the most fascinating tools is the Fibonac

Introduction Technical analysis is the language of traders. While price charts and candlestick patterns provide the foundation, indicators act as translators, helping traders in

Introduction Technical analysis is the backbone of modern trading. While price charts and candlestick patterns provide the foundation, indicators act as powerful tools that help

Introduction Moving averages are among the most widely used tools in technical analysis. They smooth out price data, highlight trends, and provide traders with actionable signals. Whether you are
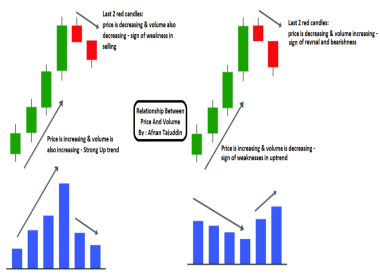
Introduction Price charts often steal the spotlight in trading discussions, but volume is the hidden force that validates every move. Without volume, price action is incomplete. Volume analysis hel

The Ultimate Guide to Support and Resistance in Stock Market Trading Introduction Support and resistance are two of the most fundamental concepts in technical analysis. They act as invisible b

Morning Star and Evening Star Candlestick Patterns with Gap Analysis Introduction Candlestick charts are more than just colorful bars on a trading screen—they are visua

Harami Candlestick Pattern: A Complete Guide to Bullish and Bearish Signals Introduction Candlestick charts are the language of price action. Each candle tells a story ab
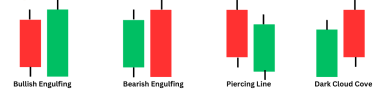
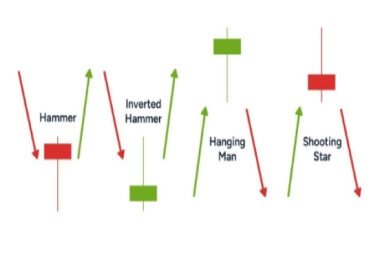
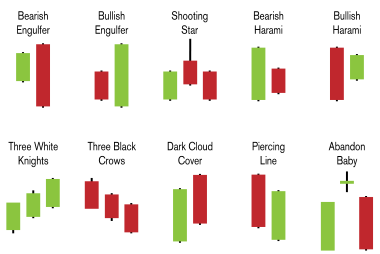
Mastering Multiple Candlestick Patterns: Engulfing, Piercing, Dark Cloud Cover & More Introduction Candlestick charts are one of the most powerful tools in technical
Introduction Candlestick charts are more than just colorful visuals on a trading screen — they are windows into market psychology. Each candle tells a story about the battle between buyers and
Introduction Candlestick charts are one of the most widely used tools in technical analysis. They provide traders with a visual representation of price action and market psychology. Among the
Introduction Candlestick charts are the backbone of modern technical analysis. They provide traders with a visual snapshot of market psychology, capturing the
Getting Started with Candlestick Patterns in Technical Analysis Introduction Trading is not just about numbers; it’s about understanding how those numbers reflect human behavior. One of th
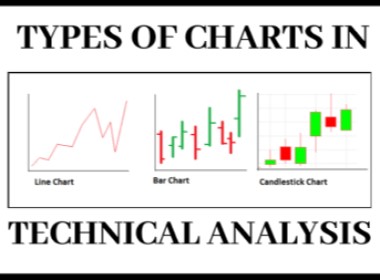
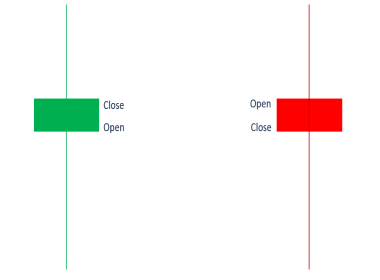
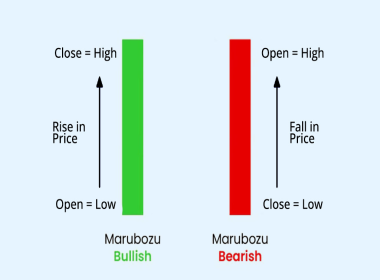
Stock Market Chart Types Explained: Line, Bar, and Candlestick Introduction When traders look at the stock market, they need a way to understand how prices move. Every trading day has four

Core Assumptions of Technical Analysis: Explained for Beginners Introduction Technical Analysis (TA) is one of the most widely used methods in trading. But before applying it, every trader m

Technical Analysis Basics: A Complete Beginner’s Guide Introduction Trading in the stock market is not just about luck. To succeed, traders need a clear plan that defines when to buy, when

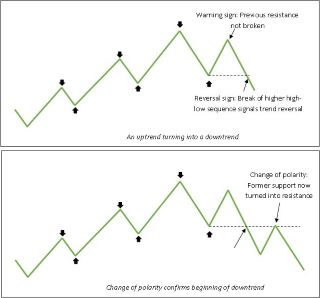
In a downtrend, prices keep making lower highs and lower lows. This means each new low goes below the previous support level, and each new high fails to rise above the previous resistance. As long as
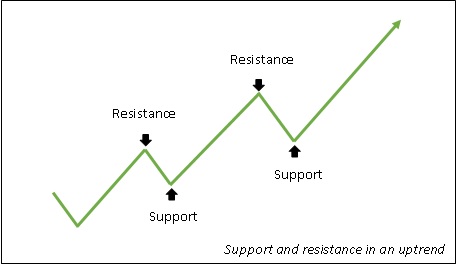
Support and resistance are important in an upward trend In an uptrend, prices usually make new highs that are higher than the previous highs (resistance) and new lows that are higher than the previou
Introduction of Technical Analysis: Support and Resistance Support and resistance are two of the terms used in technical terms the most frequently. These are two terms that are commonly used in finan
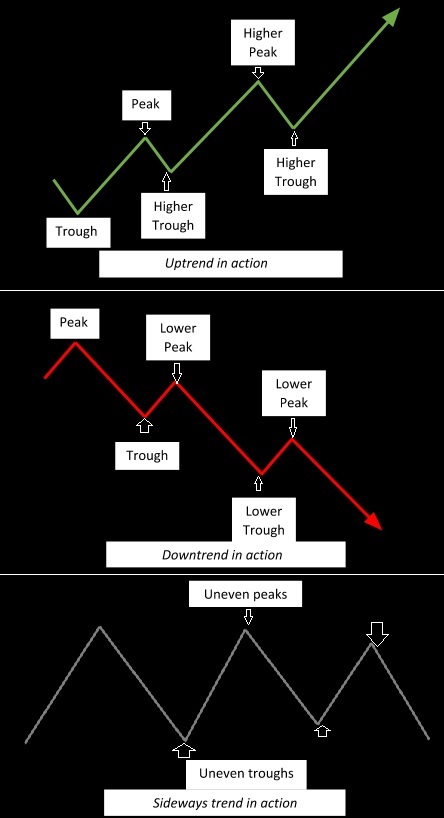
Introduction of Technical Analysis: Different kinds of trends There are three different kinds of trends: sideways, downward, and upward trends. We will now go into greater depth about each of these t

Introduction of Technical Analysis: Technical Analysis Assumptions The foundation of technical analysis consists on the following three key presumptions: Present pricing discounts all informatio
Technical analysis is a way to guess how prices will move in the future by looking at past prices and trade volume. Fundamental analysis looks at an asset's true value by considering its economic, fin
