Mastering the Equity Curve: A Complete Guide to Portfolio Performance & Risk Management
Introduction
In the world of trading and investing, numbers alone rarely tell the full story. While profit and loss statements provide snapshots of financial outcomes, they don’t capture the journey of an investment. This is where the equity curve comes into play. An equity curve is more than just a line on a chart—it’s a powerful visualization tool that helps traders and investors understand how their portfolio evolves over time, how risk is distributed, and how performance compares against benchmarks.
What is an Equity Curve?
An equity curve is a graphical representation of the value of a trading account or portfolio over time. It shows how an initial investment grows, shrinks, or fluctuates based on market performance.
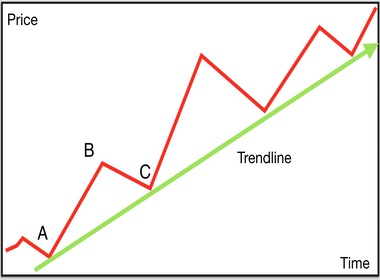
- Upward-sloping curve → Indicates consistent profitability.
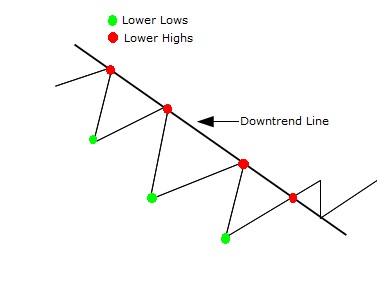
- Downward-sloping curve → Suggests losses or poor strategy execution.
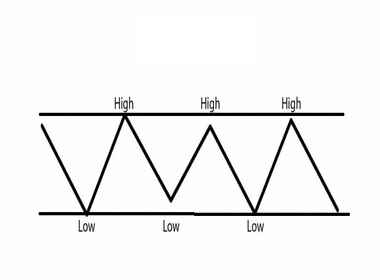
- Flat or sideways curve → Reflects stagnation, often due to lack of volatility or poor allocation.
By normalizing the portfolio to a base value (commonly ₹100 or $100), investors can easily visualize how their money would have grown or declined during the investment period.
Why Equity Curves Matter
- Performance Tracking: Shows how investments evolve daily, weekly, or monthly.
- Risk Assessment: Highlights volatility and drawdowns.
- Strategy Validation: Helps test whether a trading system is profitable over time.
- Benchmark Comparison: Allows investors to compare their portfolio against indices like Nifty 50, S&P 500, or Dow Jones.
- Psychological Control: Provides visual reassurance during market turbulence.
Building an Equity Curve Step by Step
1. Define Portfolio Composition
Select the stocks, ETFs, or assets you want to include. Assign weights to each based on your investment strategy.
- Stock A: 20%
- Stock B: 30%
- Stock C: 50%
2. Normalize Investment
Start with a base value (₹100 or $100). Allocate funds according to weights.
- ₹20 in Stock A
- ₹30 in Stock B
- ₹50 in Stock C
3. Track Daily Price Movements
Record daily closing prices of each stock. Calculate percentage changes.
4. Adjust Portfolio Value
Update each stock’s value based on daily returns. Sum them to get the portfolio’s daily value.
5. Plot the Curve
Graph the normalized portfolio value over time. The resulting line is your equity curve.
Attributes of a Strong Equity Curve
- Consistency: Smooth upward trajectory without sharp declines.
- Controlled Drawdowns: Temporary dips that recover quickly.
- Low Volatility: Avoids wild swings that indicate excessive risk.
- Benchmark Outperformance: Performs better than market indices.
Equity Curve vs. Portfolio Variance
While the equity curve shows performance visually, portfolio variance quantifies risk mathematically.
- Variance: Measures dispersion of returns.
- Standard Deviation (SD): Square root of variance, representing volatility.
If the equity curve is smooth, variance will be low. If the curve is jagged, variance will be high.
Calculating Portfolio Variance
There are two main approaches:
1. Matrix Method
- Use covariance and correlation matrices.
- Apply weights to calculate overall variance.
2. Equity Curve Method
- Treat the portfolio as a single entity.
- Calculate daily returns of the normalized portfolio.
- Apply STDEV() function in Excel or statistical software.
Both methods should yield similar results, reinforcing accuracy.
Practical Example
Imagine a portfolio of 5 stocks:
- Cipla – 10%
- Infosys – 20%
- Reliance – 30%
- HDFC Bank – 25%
- Tata Motors – 15%
Starting with ₹100, you allocate funds accordingly. Over six months, the portfolio grows to ₹115. The equity curve shows a steady upward slope, while variance calculations confirm moderate risk.
Using Equity Curves for Strategy Optimization
- Rebalancing: Adjust weights to reduce volatility.
- Stop-Loss Rules: Identify drawdown thresholds.
- Diversification: Add uncorrelated assets to smoothen the curve.
- Backtesting: Compare historical performance of different strategies.
Common Mistakes in Equity Curve Analysis
- Ignoring Adjustments: Not accounting for dividends, splits, or bonuses.
- Overfitting: Designing strategies that only work on past data.
- Short Timeframes: Drawing conclusions from limited data.
- Benchmark Neglect: Failing to compare against market indices.
Equity Curve in Trading Psychology
- Confidence Building: A rising curve boosts morale.
- Discipline Enforcement: Helps traders stick to strategies.
- Drawdown Awareness: Prevents panic selling during temporary declines.
Advanced Applications
- Monte Carlo Simulations: Stress-test portfolios under random scenarios.
- Risk-Adjusted Metrics: Combine equity curves with Sharpe ratio, Sortino ratio.
- Algorithmic Trading: Automate equity curve monitoring for real-time adjustments.
Equity Curve vs. Benchmark Indices
- If your curve outperforms Nifty 50 → Strong portfolio.
- If it underperforms → Strategy needs revision.
- If it mirrors benchmark → Portfolio is market-neutral.
Case Study: Equity Curve of a Diversified Portfolio
A diversified portfolio of 10 stocks across pharma, IT, banking, and FMCG sectors was tracked for one year.
Initial Investment: ₹100
Final Value: ₹118
Benchmark (Nifty 50): ₹112
Result: The equity curve showed smoother growth with fewer drawdowns compared to the benchmark, proving diversification benefits.
Tools for Equity Curve Analysis
- Excel/Google Sheets: Basic calculations and charting.
- Python/R: Advanced statistical modeling.
- Trading Platforms: Built-in equity curve visualization.
- Portfolio Management Software: Automated variance and risk analysis.
Best Practices
- Normalize portfolio to ₹100 for clarity.
- Update data daily or weekly.
- Compare against multiple benchmarks.
- Use both visual (equity curve) and mathematical (variance) methods.
- Document strategy changes alongside curve shifts.
Conclusion
The equity curve is one of the most powerful tools in trading and investing. It transforms raw numbers into meaningful insights, helping investors visualize performance, assess risk, and refine strategies. When combined with portfolio variance analysis, it provides a holistic view of both returns and volatility.
By mastering equity curves, traders can not only improve their portfolios but also strengthen their psychological resilience in the face of market uncertainty.